
3rd Quarter Market Overview
- The U.S. stock market has shown resilience in the 3rd quarter, with the S&P 500 posting an 8.11% gain.
- The stock market has been propelled by stronger than expected earnings and AI enthusiasm.
- Investors are largely looking past the US government shutdown.
- The market breadth is widening as lagging sectors like healthcare have begun to rally after Pfizer struck a deal with the US government where it agreed to lower prescription drug prices in exchange for tariff relief.
Fixed Income
- US yields fell during the 3rd quarter after weaker than consensus economic stats, like job growth, which has fueled expectations for more rate cuts.
- The 10-Year Treasury yield ended the quarter at 4.12%.
- 30-year mortgage at 6.41%.[1]
Commodities
- Oil prices slid further during the 3rd quarter, falling to a four-month low amid ongoing concerns about oversupply.
- Gold is making all-time highs from growing market expectations of rate cuts and safe-haven demand stemming from shutdown-related uncertainty and bets against the US Dollar. Gold ended the 3rd quarter at an all-time high of $3,858./oz.
Economic Summary
- The US government entered a partial shutdown on Wednesday October 1st. Some critical agencies and programs will continue to operate, such as TSA and immigration related functions, which had been pain points in previous shutdowns. However, data releases that are critical to capital markets, such as the nonfarm payroll jobs report, will likely be delayed until the shutdown concludes.
- Public pressure to strike a deal may grow if federal employees miss paychecks, as many federal employees are paid biweekly. Historically, shutdowns have had a mixed, short-lived impact on markets, but the effects of the shutdown will depend on its duration.
- Globally, consensus estimates call for real GDP growth to slow to 2.5% year over year in 2025. Reflecting headwinds from higher US tariffs.[2]
- In the US, real GDP growth is expected to slow to 1.7%.2
- Inflation: Core inflation in the U.S. is trending lower, but there is concern that it may rise by the end of the year to 3.2% from higher US tariffs
- The Fed: The Federal Reserve remains cautious, with the market estimating a 94% probability of a 25-basis point cut in October and 86% probability of a cut in December.2
- Jobs Report: Unemployment rates have edged up to 4.2%, with consensus estimates at 4.3% by year end. Outside the US, the Euro area unemployment rate increased to 6.3% in August, above expectations.
- Economic Activity: US ISM and Services & Manufacturing PMI were below expectations at 51.7 and 49.1. A reading below 50 indicates contraction.
Public Equity Insights
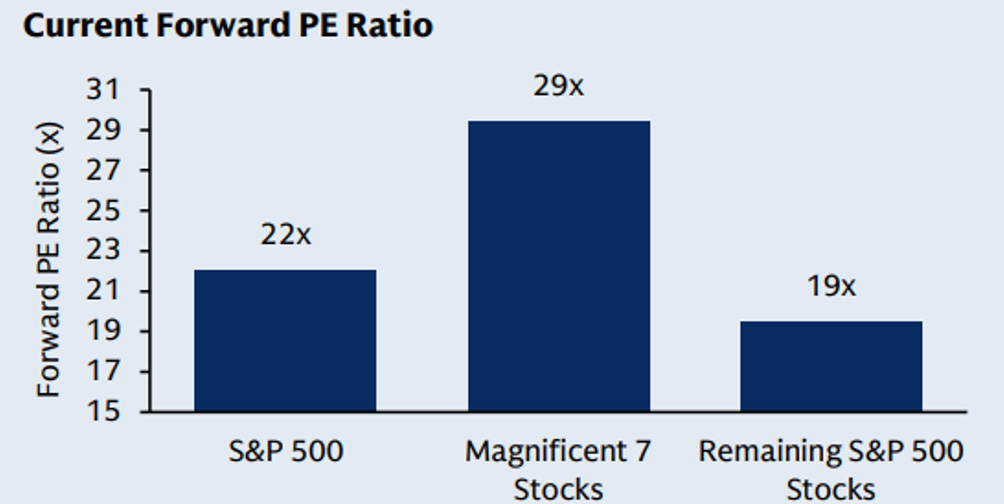
- A simple valuation metric, the price-to-earnings (PE) ratios of the Magnificent 7 (Alphabet, Amazon, Apple, Meta Platforms, Microsoft, Nvidia, and Tesla) stand at 29 times and that of the S&P 500 overall at 22. While we acknowledge investors are concerned that the index’s valuation levels may seem high compared to the historical average of high teens (Average PE ratio is 17.8 times based on earliest available data from Dec 1927. (Source: Macrotrends), we believe that the growth rate of the S&P 500 has fundamentally changed. In the last 30 years, earnings grew at about 9% per year, but over the last three years, the growth rate has been 11% annually. During the 2Q reporting season, 60% of companies in the S&P 500 raised their forward guidance for full-year earnings per share (EPS), indicating a positive outlook. In our view, the structurally higher valuation may be deserved given the changed character of the market.
[1] Bankrate.com
[2] Bloomberg
- AI-driven investments are propelling the current capex cycle, with leading technology firms ramping up spending to develop and deploy AI solutions. Rather than slowing, investment is accelerating, as organizations boost model training and inference capacity. Intensifying competition and a surge of proprietary innovation have attracted further corporate and government funding. We believe we are still in the early to middle stages of AI infrastructure growth and that AI capex will remain durable into the next year.
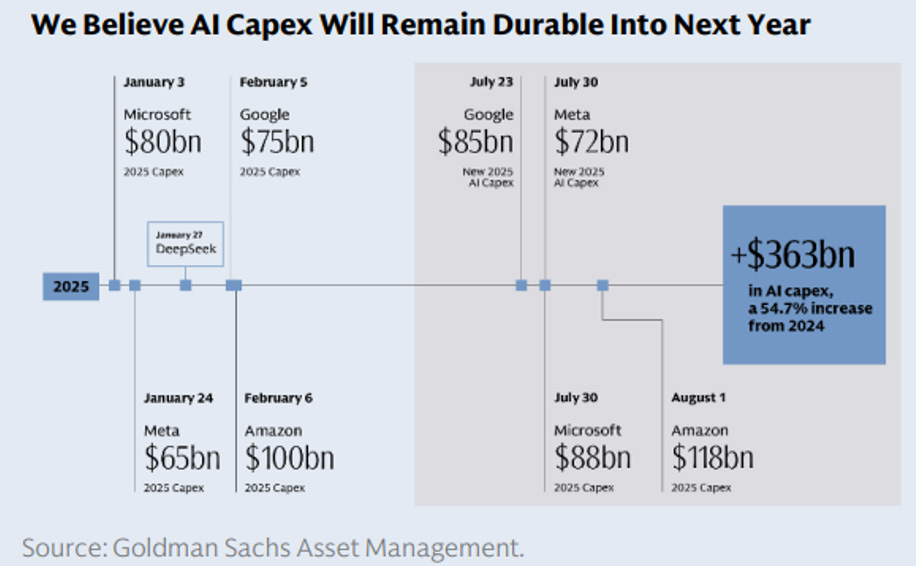
- The chart above shows the amount of money large technology companies are spending to build out AI infrastructure. A majority of that money goes into building data centers, purchasing hardware (e.g. Nvidia chips), and providing power sources.
I read the news, Oh boy…
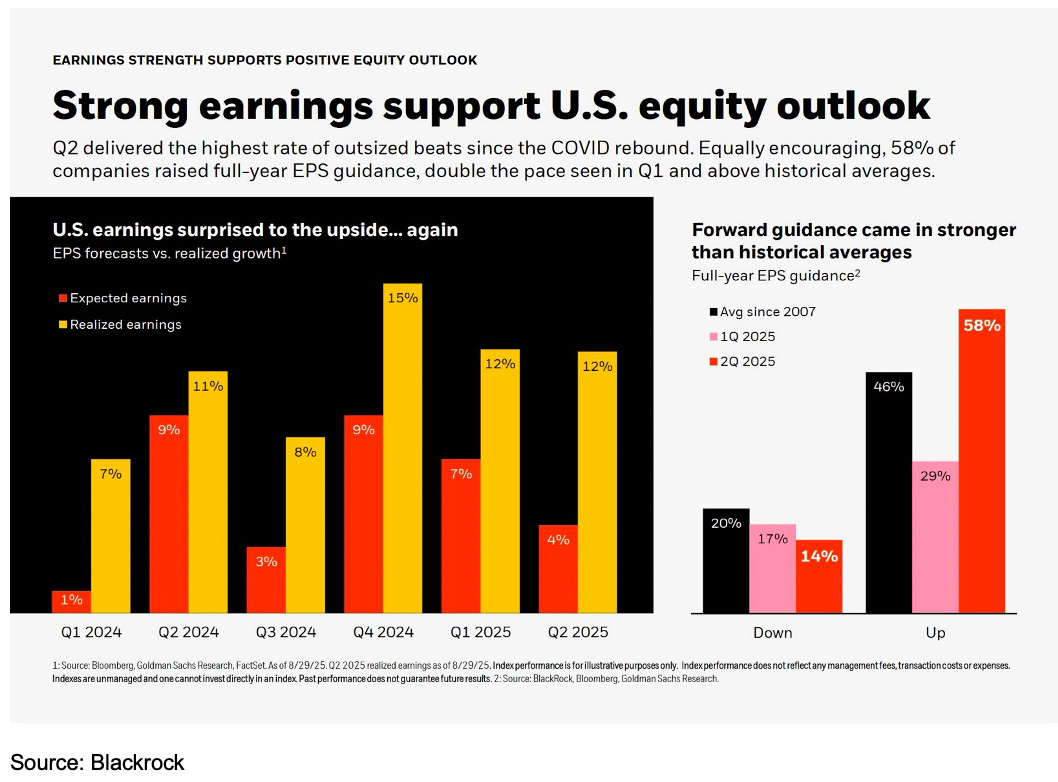
Despite the trade uncertainty, government shutdown, political assassinations, troops being sent to Oregon, and softer economic data, the stock market sprinted to fresh highs in September. The market primarily cares about corporate earnings. US corporate earnings in the first half of the year topped expectations, beating market estimates by double digits. Barclays points out that drag from tariffs has proven less severe than initially anticipated. Resilient corporate earnings can, of course, support stock prices. This reinforces the view that the so-called US exceptionalism theme suffered only a brief setback and is far from unwinding.
Below is a chart that shows the expected earnings in red, versus the actual earnings that were reported, in yellow. This illustrates the robustness of earnings and their ability to surprise to the upside. Corporations have been navigating a difficult environment well.
Is AI a Bubble?
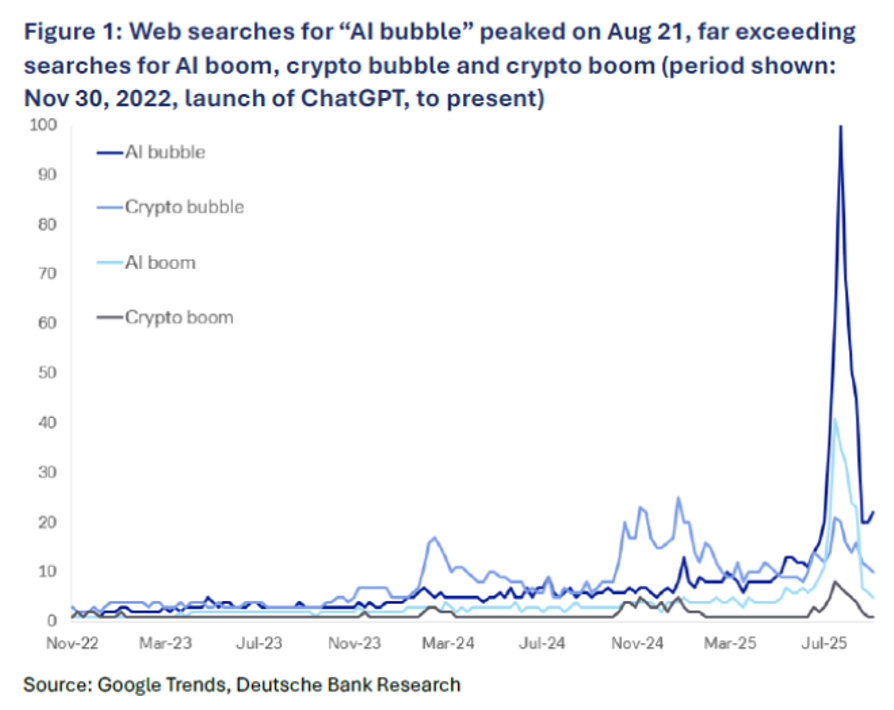
Lately, well known investors are writing about the “AI Bubble”. There are serious attempts to diagnose the current investment climate. Even google search trends show a spike in bubble interests.
This raises the issue of the most obvious parallel for the AI excitement. A quarter-century has now passed since the dot-com bombed; does this mean that its lessons have not been learned?
For those of us who lived through the dot-com bubble and burst, we can say there is a difference between living through it, and reading about it. Most money managers today do not carry the scars of the dot-com era. Of the approximately 1700 active large-cap US portfolio managers, just 4% invested through that period.[1]
Biggest Bubbles in financial history:
- 1630s – The Tulip Mania in Holland
- 1720 – The South Sea Bubble in the UK, and the Mississippi Bubble in France
- 1790s – The Canal Mania in the UK
- 1840s – The Railway Bubble in the UK
- 1873 – The Railway Bubble in the US
- 1920s – The Stock Market Boom in the US
- 1980s – The Land and Stock Bubble in Japan
- 1990s – The Technology Bubble, Global
- 2007 – The Housing / Banking Bubble in the US (and Europe)
(source: A short history of financial euphoria, by John Galbraith)
Bubbles are hard to diagnose, but in hindsight the biggest were in technologies that proved revolutionary – canals, railroads, cars, and the internet. They do, however, rely on cheap money.
Robert Kindleberger, in his classic Mania, Panics, and Crashes, produced a schema for all great bubbles:
- Cheap money underpins and creates the bubble
- Debt is taken on during the bubble buildup, which helps fuel speculative price increases.
- Once a bubble is formed, the asset price has a notably expensive valuation
- There’s always a convincing narrative to “explain away” the high price.
AI probably will have profound consequences on the way we all work. But there may be some pain ahead before we all enjoy the businesses that are being built. The good news is that the critical difference between dominant technology companies today and those of the technology bubble is that valuations are much less extreme, and the fundamentals of the businesses are much stronger. A central driver of bubbles in the past is that rising valuations reach a level that makes unrealistic claim on future potential revenues. The difference with companies today is that price appreciation has been justified by strong profit and fundamentals so far.
Investment Strategy
The US stock market has been in a wealth creation mode by gaining 92% since the lows of October 2022. The market is not cheap, but we don’t believe comparisons to 2000 are accurate because today’s corporate earnings provide support. We continue to see opportunities with international markets as they provide an attractive discount to US markets.
On the fixed income side, the portfolio management team from Pacific Investment Company have boldly declared that there is a “once in a generation” opportunity in developing-nation local bonds. The catalyst was on April 2 when President Donald Trump unleashed a global trade war and shook investor confidence in the US economy so much that it sparked a stampede out of the US dollar. Much of the money has flowed into other developing countries, reviving a market that for more than a decade had been relegated to a mere afterthought in investing circles. We acknowledge that international and emerging debt markets have been stuck in a funk for over a decade. A key point that favors international is that valuations are cheap and economic fundamentals in many countries are strong. If the dollar continues to weaken relative to foreign currencies, the current rally overseas could prove to be more than just a head fake.
[1] https://gqg.com/insights/dotcom-on-steroids/